In this LAB note
Question · Hypothesis · Method · Results · What Failed · What We Learned · What Changed at MOMS
Question
Two of our recipes are built from an identical set of seven ingredients. One carries an internal Score of 16, the other a 20, the top of our scale. If the pantry is the same, those four points have to be bought with grams. Which grams?
Hypothesis
We expected the Score to reward nutrient density. Under that assumption the 20 should carry more produce, more fiber and more protein than its 16-point twin, because those are the levers we reach for whenever we talk about a better shake. We also expected the same direction to show up across all 201 recipes, not only inside one pair.
Method
Published research first. Jenkins and colleagues (British Medical Journal, 1978) ran 50 g glucose tolerance tests in groups of four to six volunteers, adding guar, pectin, gum tragacanth, methylcellulose, wheat bran or cholestyramine at a dose equivalent to 12 g of fibre. Every substance lowered blood glucose at one or more points, but the size of the effect tracked viscosity rather than fibre mass: the reduction in mean peak glucose rise correlated with viscosity at r = 0.926 (P < 0.01), and the flattening produced by guar disappeared entirely once the guar was hydrolysed to a non-viscous form. Gentilcore and colleagues (Journal of Clinical Endocrinology and Metabolism, 2006) gave six men with type 2 diabetes 30 ml of olive oil thirty minutes before a mashed potato meal in a randomised crossover; gastric emptying slowed markedly (P < 0.0001), the postprandial glucose rise was delayed (P = 0.03), and the insulin and GIP responses were attenuated while GLP-1 rose. Taken together, these say that a gram of fibre and a gram of fat are not interchangeable proxies for how a mixed meal behaves. Then the recipe data. We parsed all 201 rows of the production recipe sheet and split each of the six formulation slots into ingredient names and doses. Four pairs of recipes turned out to share an identical ingredient name set, which makes them a natural experiment: the pantry is held constant and only the grams move. We read the Score change across those pairs, then checked whether the same direction held across the full 201 by grouping every recipe into Score bands and comparing mean macros.
Results
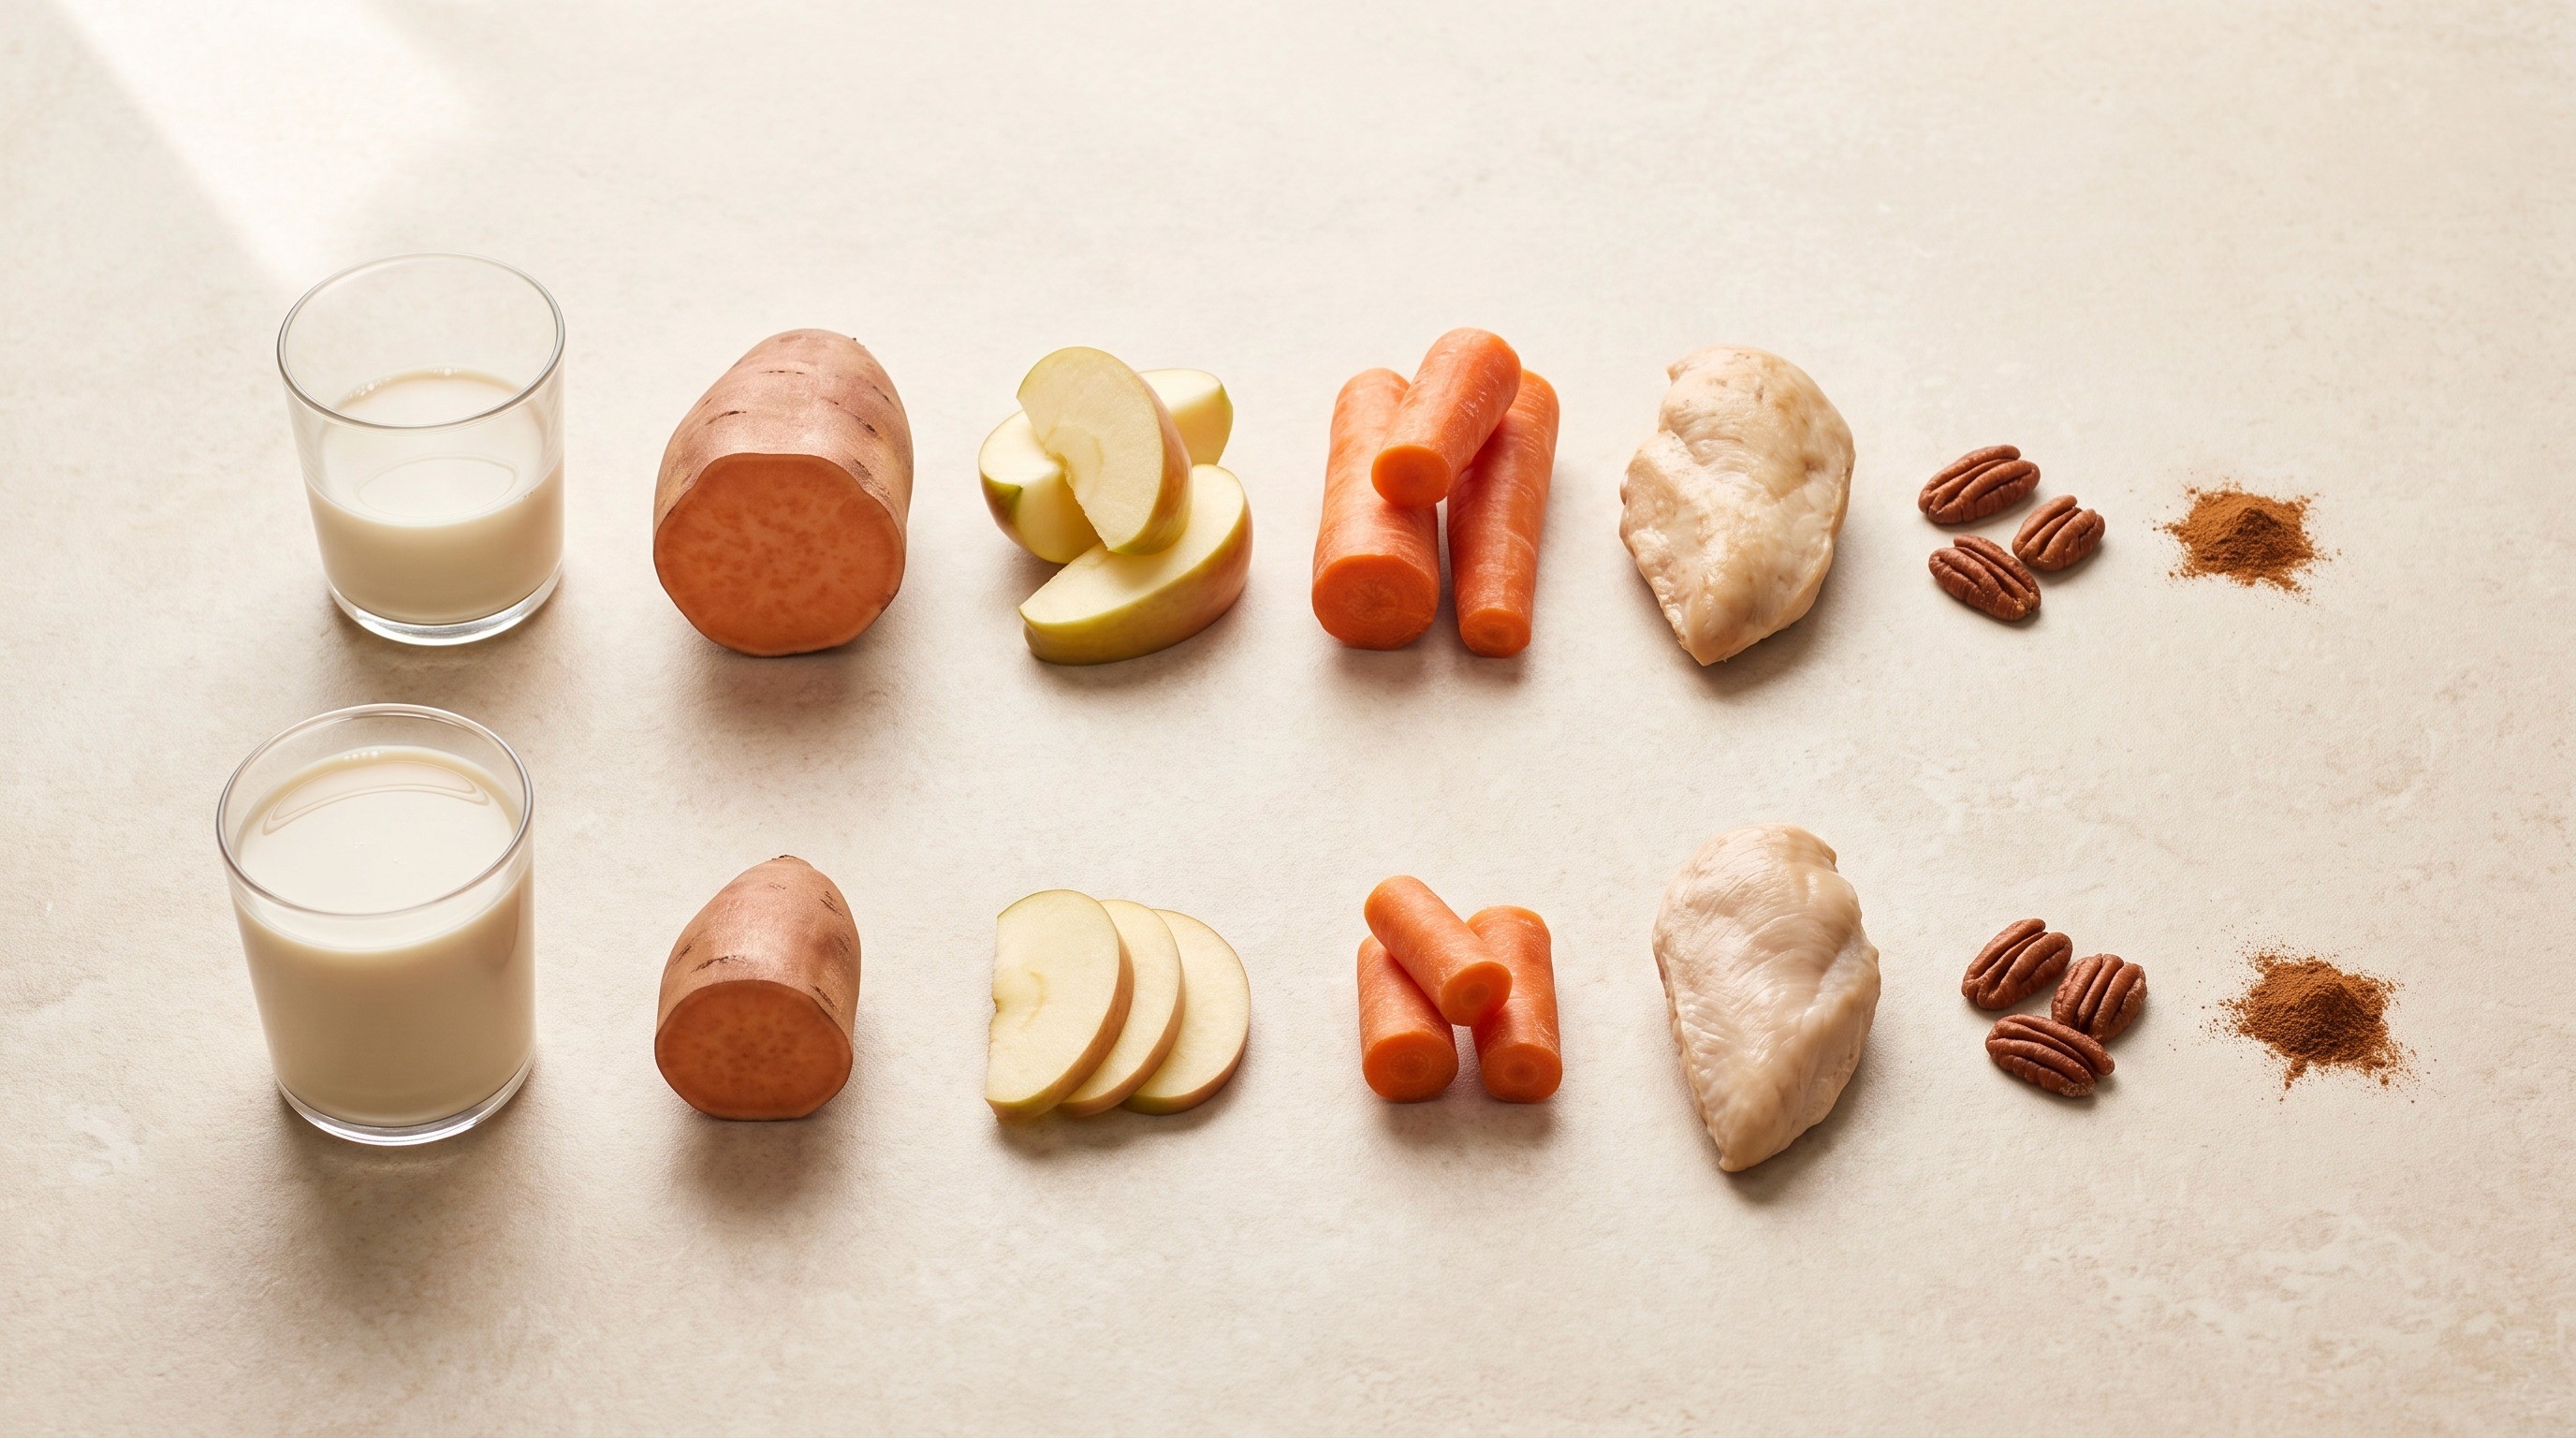
WAI-W2-PROTEIN-010-V1 ("Renewed Power", Score 16) and WAI-W3-NUTR-001-V1 ("Antioxidant Glow", Score 20) are built from the same seven ingredients: soy milk, sweet potato, apple, carrot, chicken, pecan and cinnamon, plus agave. Chicken is identical at 90 g and cinnamon at 1 g. Everything else moves. Sweet potato falls from 70 g to 58.5 g, apple from 80 g to 55 g and carrot from 60 g to 25 g — 71.5 grams of plant matter removed. Agave is halved, 5 g to 2.5 g. Soy milk rises from 160.6 ml to 195 ml and pecan from 7.8 g to 9 g. On the label, carbohydrate drops from 38.5 g to 27.8 g, fat rises from 12.1 g to 13.5 g, protein rises from 35.9 g to 36.5 g, and fiber falls from 7.6 g to 6.0 g. Calories fall from 399.7 to 374.4. The four extra points were bought with less carbohydrate and slightly more fat, and they came with less fiber, not more. The same direction holds across the library. The 57 recipes scoring 13 or below average 41.9 g carbohydrate, 9.2 g fat and 8.2 g fiber. The 37 scoring 17 or above average 38.4 g carbohydrate, 10.9 g fat and 7.3 g fiber. The six recipes at the top of the scale average 35.3 g carbohydrate, 12.1 g fat and 6.4 g fiber. Protein barely separates those groups at all — 32.7 g against 33.1 g — and mean calories differ by three.
What Failed
The correlations are too weak to call this a rule. Across all 201 recipes, Score correlates with fat at r = +0.21, with carbohydrate at r = −0.18 and with fiber at r = −0.17. None of those explains more than five percent of the variation in Score. The bands are not monotonic either: the 21 recipes at Score 17 average 40.1 g carbohydrate and 8.0 g fiber, more of both than the recipes scoring 15 and 16 below them. Our single Score-19 recipe carries 52.6 g of carbohydrate, one of the highest figures anywhere in the library, sitting two points from the top of the scale. The pair evidence has its own hole. MY-W3-GUT-004-V1 ("Rooted Calm") and MY-W3-GUT-006-V1 ("Settled Mind") share the same six ingredients and differ by 4.5 g of fiber (12.8 against 8.3) and 4.1 g of carbohydrate — and both score exactly 13. A lever that moved the Score four points in one pair moved it zero in another. Of the four ingredient-identical pairs, one is identical down to the gram: WAI-W1-WARM-007-V1 and WAI-W3-NUTR-004-V1 are the same formula filed under two different Goal names, and both score 16. That leaves three usable observations, which is an argument for a hypothesis, not a demonstration of one. The cited research does not carry the weight either. Gentilcore’s crossover ran six men with type 2 diabetes and used a pre-load of oil rather than fat blended into the meal. Neither the population nor the delivery matches a whole-food shake drunk by a healthy adult, and we are using it for direction, not for magnitude.
What We Learned
Our Score is behaving like a carbohydrate-load control, not a nutrient-density measure. When the ingredient list is fixed, points arrive by taking carbohydrate out and letting fat sit slightly higher — which is a defensible thing for a scoring system to do, and roughly what the postprandial literature would predict. But it is not what the word "score" implies to someone reading it, and it is not what we had assumed internally. Fiber, the lever we reach for first in conversation, moves the wrong way. Jenkins is the reason that is not automatically a failure: fibre grams are a poor proxy for what fibre does, because the effect tracks viscosity. Six grams of chia is not six grams of carrot.
What Changed at MOMS
We have stopped treating the Score as a summary of how good a shake is and started reading it for what the data says it is. Two changes follow. First, the Score is no longer used on its own to rank two formulations for the same body type and goal; fiber and produce mass are now read alongside it, because the pairs show Score can rise while both fall. Second, we are separating fiber mass from fiber type in the recipe sheet, tagging the viscous sources — chia, flaxseed, oat — apart from the bulk sources such as carrot, cabbage and broccoli, so that the next version of the Score can weight the gram that slows a meal differently from the gram that only adds weight to it.
References
Jenkins DJ, Wolever TM, Leeds AR, Gassull MA, Haisman P, Dilawari J, Goff DV, Metz GL, Alberti KG. "Dietary fibres, fibre analogues, and glucose tolerance: importance of viscosity." British Medical Journal, 1(6124):1392–1394, 1978. | Gentilcore D, Chaikomin R, Jones KL, Russo A, Feinle-Bisset C, Wishart JM, Rayner CK, Horowitz M. "Effects of fat on gastric emptying of and the glycemic, insulin, and incretin responses to a carbohydrate meal in type 2 diabetes." Journal of Clinical Endocrinology and Metabolism, 91(6):2062–2067, 2006.
Keep reading
Previous experiment
Not sure which shake fits you? We match the formulation to your body type.
Find your body type